
Submitted FP8 Llama 3.1-8B to MLPerf Inference v6.1
Published:
The MLPerf Inference v6.1 results are now public:
I had the opportunity to submit results for Llama 3.1-8B on a single NVIDIA H200 SXM 141 GB accelerator in the MLPerf Closed division, Datacenter category.
The measured performance was:
- Offline: 7,796.59 output tokens/s
- Server: 7,376.60 output tokens/s
The complete submission, including system configuration, benchmark configuration, accuracy artifacts, calibration documentation, and scenario-specific READMEs, is available in the MLCommons results repository:
github.com/mlcommons/inference_results_v6.1 → closed/Naeem Khoshnevis
The interactive results dashboard is available at: MLPerf Inference - Datacenter Dashboard
The purpose of this post is not to interpret the result as a hardware ranking. Instead, it documents several technical aspects of producing a valid and reproducible MLPerf inference submission: quantization, calibration, load generation, Server operating-point selection, network configuration, KV-cache behavior, and independent validation of the final artifacts.
Benchmark constraints
The MLPerf Closed division constrains several components of the benchmark so that system-level optimizations can be evaluated without changing the underlying task. For this workload, the model, dataset, and accuracy requirements are fixed. The implementation may optimize execution and serving and may use permitted quantization techniques, but it may not replace the model or dataset or obtain throughput by violating the required accuracy constraints.
For Llama 3.1-8B, the benchmark uses CNN/DailyMail summarization over the 13,368-example validation set. The submitted Offline and Server accuracy results were:
| Metric | Required floor | Offline | Server |
|---|---|---|---|
| ROUGE1 | 38.3914 | 38.6405 (+0.65%) | 38.6354 (+0.64%) |
| ROUGE2 | 15.7484 | 15.9282 (+1.14%) | 15.9256 (+1.13%) |
| ROUGEL | 24.2507 | 24.5018 (+1.04%) | 24.4991 (+1.02%) |
| ROUGELSUM | 35.4351 | 35.7399 (+0.86%) | 35.7316 (+0.84%) |
All 13,368 validation examples were scored in both scenarios, with zero empty responses and zero failed samples. Offline and Server evaluate different system properties.
Offline presents the workload without request-level arrival constraints and measures aggregate throughput. It is primarily useful for characterizing the sustained processing rate of the system.
Server models an online service. Requests arrive according to a Poisson process at a configured target rate. A valid result must satisfy both the throughput requirement and the latency constraints. For this benchmark, the relevant 99th-percentile limits are:
- TTFT: less than 2,000 ms
- TPOT: less than 100 ms
The Server scenario is therefore an operating-point search rather than a direct peak-throughput measurement. Increasing the offered load improves throughput only until one of the latency constraints becomes binding.
Quantization and engine configuration
The submitted model used:
- FP8 weights and activations
- FP8 KV cache
- NVIDIA ModelOpt post-training quantization
- static per-tensor scaling
- TensorRT-LLM
trtllm-buildtrtllm-serve
The model was quantized using W8A8 FP8 post-training quantization and subsequently compiled into a TensorRT-LLM engine. One important constraint in the Closed division is calibration data. Calibration must use the dataset provided for the benchmark rather than arbitrary external data. The official CNN/DailyMail calibration list contains 1,000 entries corresponding to 998 unique document identifiers. The ModelOpt calibration run used a 512-row prefix of that list.
Static per-tensor scaling
Static per-tensor quantization computes a fixed scale for each tensor during calibration. The alternative would be to introduce more dynamic or fine-grained scaling behavior during execution. The static configuration simplifies the inference path because no additional token-level scale estimation is required at runtime. The corresponding trade-off is reduced flexibility in representing activation distributions. In this case, the resulting model remained above all required ROUGE thresholds, although the available accuracy margin was relatively small. The tightest margin was approximately 0.6–1.1%, depending on the metric and scenario. This made independent accuracy verification particularly important.
Load generation through the endpoints harness
The submission used the MLCommons endpoints harness rather than integrating classic LoadGen directly into the inference process. The architectural distinction is significant. With classic LoadGen, the load generator is linked into the system under test and communicates with it through an in-process interface. The endpoints harness instead behaves as an external HTTP client and drives an OpenAI-compatible inference server. The execution path is therefore approximately:
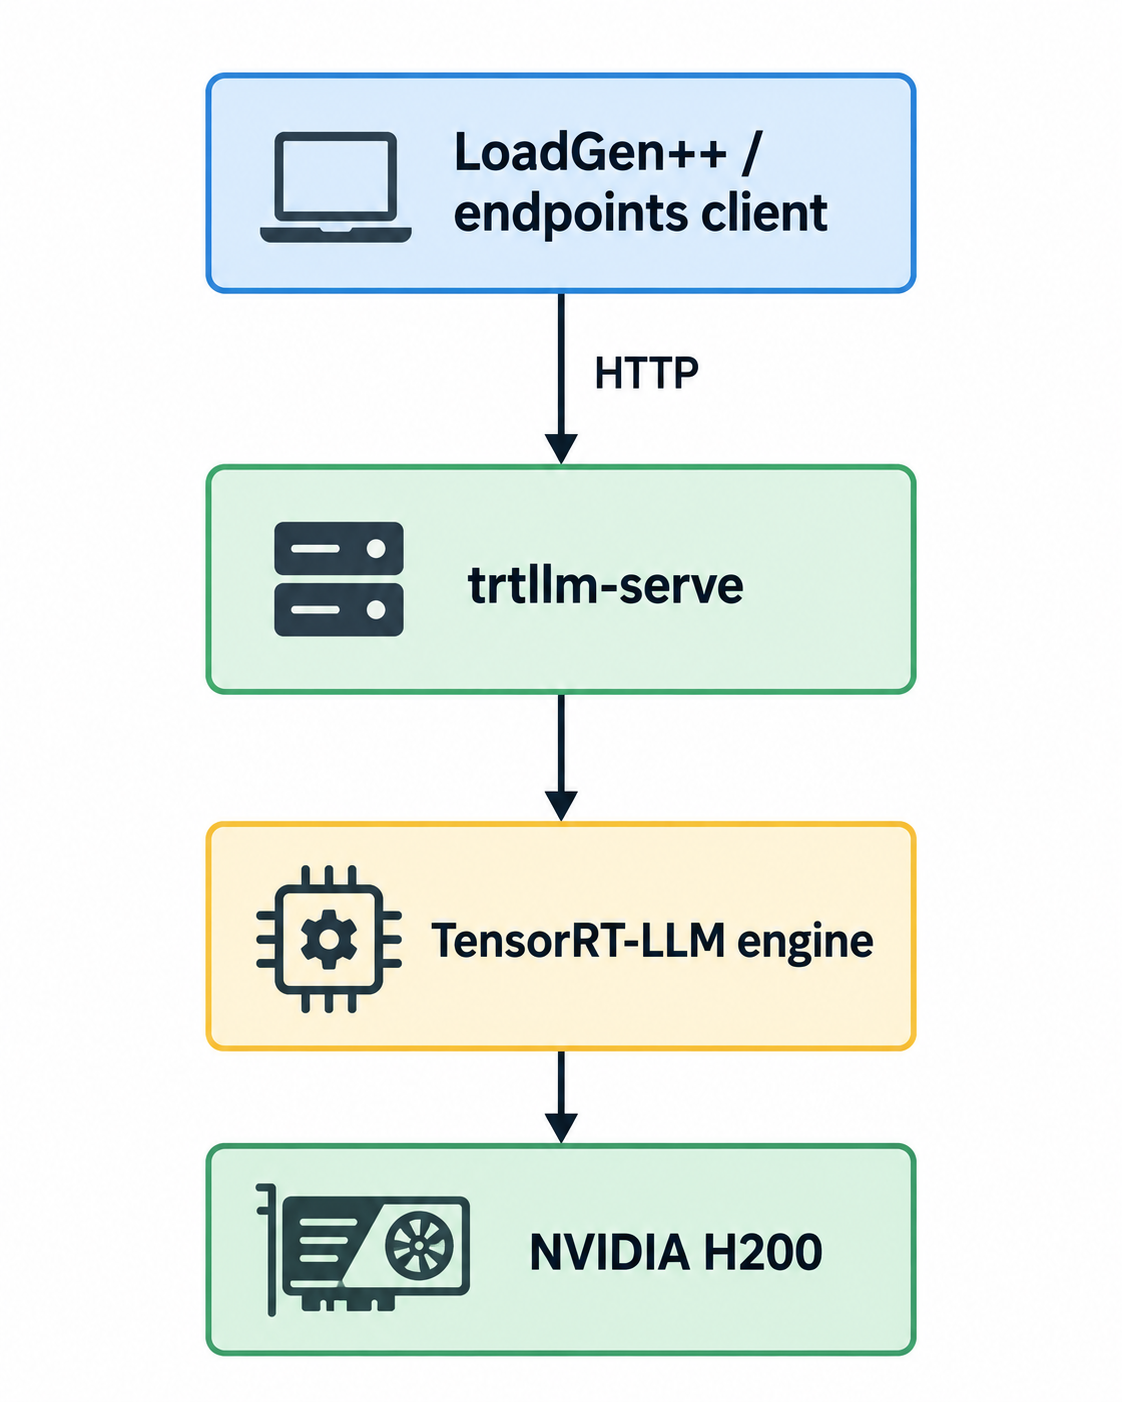
This more closely resembles a deployed inference service, but it also introduces additional system components into the measurement path:
- HTTP connection management
- client concurrency
- socket allocation
- operating-system network limits
- server queueing
- request serialization and deserialization
- client-side token accounting
The endpoints harness re-tokenizes returned text on the client side to determine output-token counts rather than relying exclusively on server-reported token statistics. Consequently, both the inference engine and the client-server transport layer become relevant to benchmark correctness.
Offline execution
The Offline scenario requires a sufficiently long measurement interval. At the measured throughput, processing one copy of the 13,368-example dataset would complete substantially earlier than the required measurement duration. The run therefore used three repetitions of the dataset:
13,368 samples × 3 = 40,104 queries
The resulting measured duration was:
658.34 seconds
with a throughput of:
7,796.59 output tokens/s
The use of repeated prompts also exposed an important issue related to KV-cache reuse, discussed below.
Server operating-point selection
Server performance depends strongly on the configured request arrival rate. The benchmark generates requests according to a Poisson arrival process using a target QPS selected by the submitter. The final configuration used:
Target QPS = 58
and produced:
Throughput: 7,376.60 output tokens/s
Duration:   695.88 s
The corresponding tail latencies were:
99th-percentile TTFT: 1,495.94 ms
99th-percentile TPOT:    61.22 ms
against limits of:
TTFT < 2,000 ms
TPOT <   100 ms
Finding the appropriate Server operating point required iterative load sweeps. Earlier configurations operated at target QPS values of approximately 12 and 30. Changes to the TensorRT-LLM engine configuration and serving stack subsequently allowed operation at QPS 58 while remaining within the latency constraints. This distinction is useful when interpreting Server measurements: system performance depends not only on kernel-level execution speed but also on scheduler behavior, batching, KV-cache capacity, queueing, concurrency, and tail-latency stability.
Early-stopping latency statistics
A further detail is that MLPerf Server validity is not determined solely by reading the raw empirical p99 latency. The benchmark applies an early-stopping statistical criterion intended to ensure that sufficient samples have been observed to establish the required percentile with adequate confidence. For this reason, Server tuning should be performed against the benchmark’s effective validity criterion rather than against the raw p99 alone. A configuration that appears comfortably below the nominal latency threshold based only on an observed percentile may still have insufficient statistical margin.
Interpreting the throughput result
The most useful interpretation of a single-accelerator benchmark result is not necessarily its position relative to unrelated accelerator configurations.
MLPerf submissions may differ in:
- GPU architecture
- memory capacity
- memory bandwidth
- numerical precision
- supported tensor-core formats
- serving implementation
- batching strategy
- KV-cache capacity
- generation configuration
In the v6.1 result set, the Llama 3.1-8B submissions span a wide range of datacenter and workstation-class accelerators and numerical precisions (FP8, FP4, NVFP4, and INT8), including NVIDIA H200 (Hopper), NVIDIA Blackwell and Blackwell Ultra, NVIDIA RTX PRO Blackwell, AMD Instinct MI350X/MI355X (CDNA 4), and Intel Arc Pro.
For context, the reported per-accelerator results are summarized below.
Offline
| Per-GPU tokens/s | Precision | Accelerator | Architecture |
|---|---|---|---|
| 45,821 * | NVFP4 | NVIDIA B200-SXM-180GB | Blackwell |
| 21,389 / 21,266 / 20,221 | FP4 | NVIDIA B300-SXM-270GB | Blackwell Ultra |
| 19,910 / 19,882 / 19,807 / 19,712 / 18,040 | FP8 | AMD Instinct MI355X 288GB | CDNA 4 |
| 16,243 | FP8 | AMD Instinct MI350X 288GB | CDNA 4 |
| 9,205 | FP8 | AMD Instinct MI350P | CDNA 4 |
| 7,797 | FP8 | NVIDIA H200-SXM-141GB | Hopper |
| 6,371 / 6,307 / 6,228 / 6,128 | FP4 | NVIDIA RTX PRO 6000 Blackwell SE | Blackwell (workstation) |
| 2,404 / 2,380 / 2,350 | FP4 | NVIDIA RTX PRO 4500 Blackwell | Blackwell (workstation) |
| 1,244 / 1,153 / 1,149 | INT8 | Intel Arc Pro B70 | Intel Arc |
Server
| Per-GPU tokens/s | Precision | Accelerator | Architecture |
|---|---|---|---|
| 21,744 / 20,420 / 19,608 | FP4 | NVIDIA B300-SXM-270GB | Blackwell Ultra |
| 18,890 / 18,589 / 18,574 / 18,570 / 18,515 | FP8 | AMD Instinct MI355X 288GB | CDNA 4 |
| 15,213 | FP8 | AMD Instinct MI350X 288GB | CDNA 4 |
| 9,038 | FP8 | AMD Instinct MI350P | CDNA 4 |
| 7,377 | FP8 | NVIDIA H200-SXM-141GB | Hopper |
| 6,190 / 6,147 / 6,128 / 6,125 | FP4 | NVIDIA RTX PRO 6000 Blackwell SE | Blackwell (workstation) |
| 2,319 / 2,285 / 2,273 | FP4 | NVIDIA RTX PRO 4500 Blackwell | Blackwell (workstation) |
| 1,052 / 1,043 / 1,031 | INT8 | Intel Arc Pro B70 | Intel Arc |
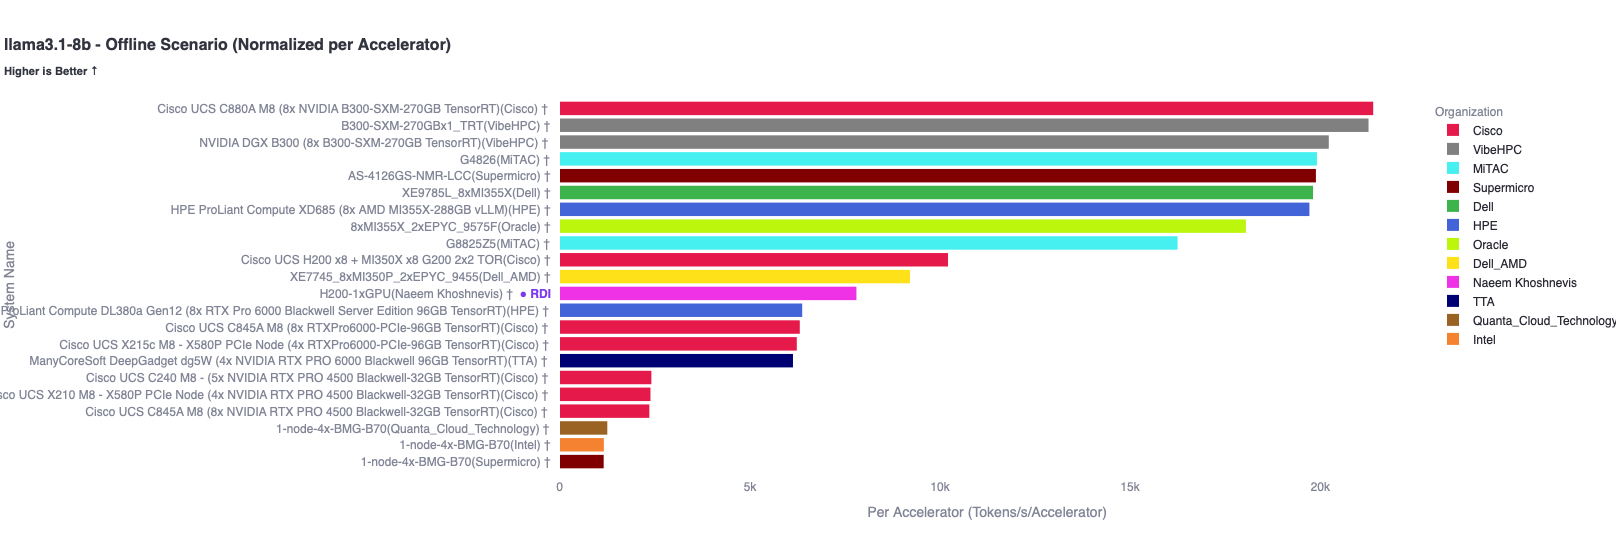
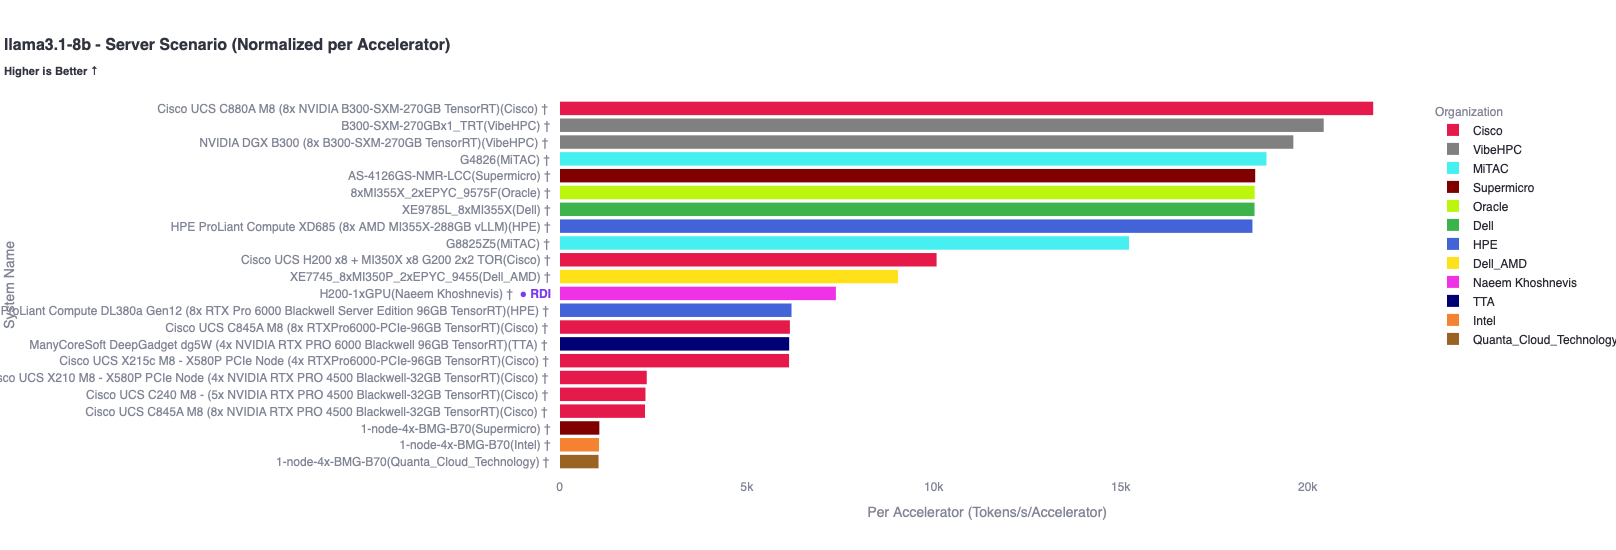
These values should not be interpreted as controlled accelerator-to-accelerator comparisons.
For autoregressive decoding, each generated token requires substantial movement of model state through the memory hierarchy. Once arithmetic throughput is sufficiently high, memory bandwidth, memory capacity, batching, and KV-cache behavior can become major throughput constraints.
For example, the H200 provides approximately 141 GB of HBM3e capacity and roughly 4.8 TB/s of memory bandwidth, whereas newer accelerator configurations may provide substantially greater capacity and bandwidth.
A simple bandwidth ratio can therefore be useful as a first-order roofline heuristic:
higher sustainable memory bandwidth
              ↓
greater potential decoding throughput
but it should not be treated as a direct performance prediction.
Actual throughput depends on multiple additional factors, including:
- kernel efficiency
- GEMM shapes
- attention implementation
- batch size
- sequence-length distribution
- scheduler behavior
- KV-cache layout
- memory utilization
- tensor-core utilization
- software maturity
Memory capacity also matters independently of bandwidth because it determines how much KV state can remain resident and therefore affects the number of concurrent sequences that can be serviced.
Precision must also be considered
Some v6.1 submissions use FP4 on Blackwell-class accelerators. Those measurements should be interpreted separately from FP8 Hopper results. Reducing model representation from FP8 to FP4 can significantly reduce weight traffic. For workloads whose decoding phase is strongly bandwidth-limited, reducing bytes transferred per token can materially change the achievable throughput. Blackwell also provides hardware support for low-precision formats that is not present in Hopper in the same form. Consequently, comparisons across FP8 Hopper and FP4 Blackwell systems combine at least three variables:
accelerator architecture
+ memory subsystem
+ numerical representation
They therefore cannot isolate implementation quality.
A more useful engineering question is whether the measured system is operating consistently with the constraints of its own hardware and software stack.
Summary
This submission used a single NVIDIA H200 SXM 141 GB accelerator to run Llama 3.1-8B with FP8 weights, activations, and KV cache through TensorRT-LLM 1.0.0.
The final measured performance was:
Offline: 7,796.59 output tokens/s

Server:  7,376.60 output tokens/s
         QPS = 58
         p99 TTFT = 1,495.94 ms
         p99 TPOT = 61.22 ms
All 13,368 accuracy samples were successfully evaluated in both scenarios and satisfied the required ROUGE thresholds.
The more interesting part of the exercise was not the final throughput number itself, but the number of system-level details that had to be controlled for the number to be meaningful.
A valid inference benchmark depends simultaneously on:
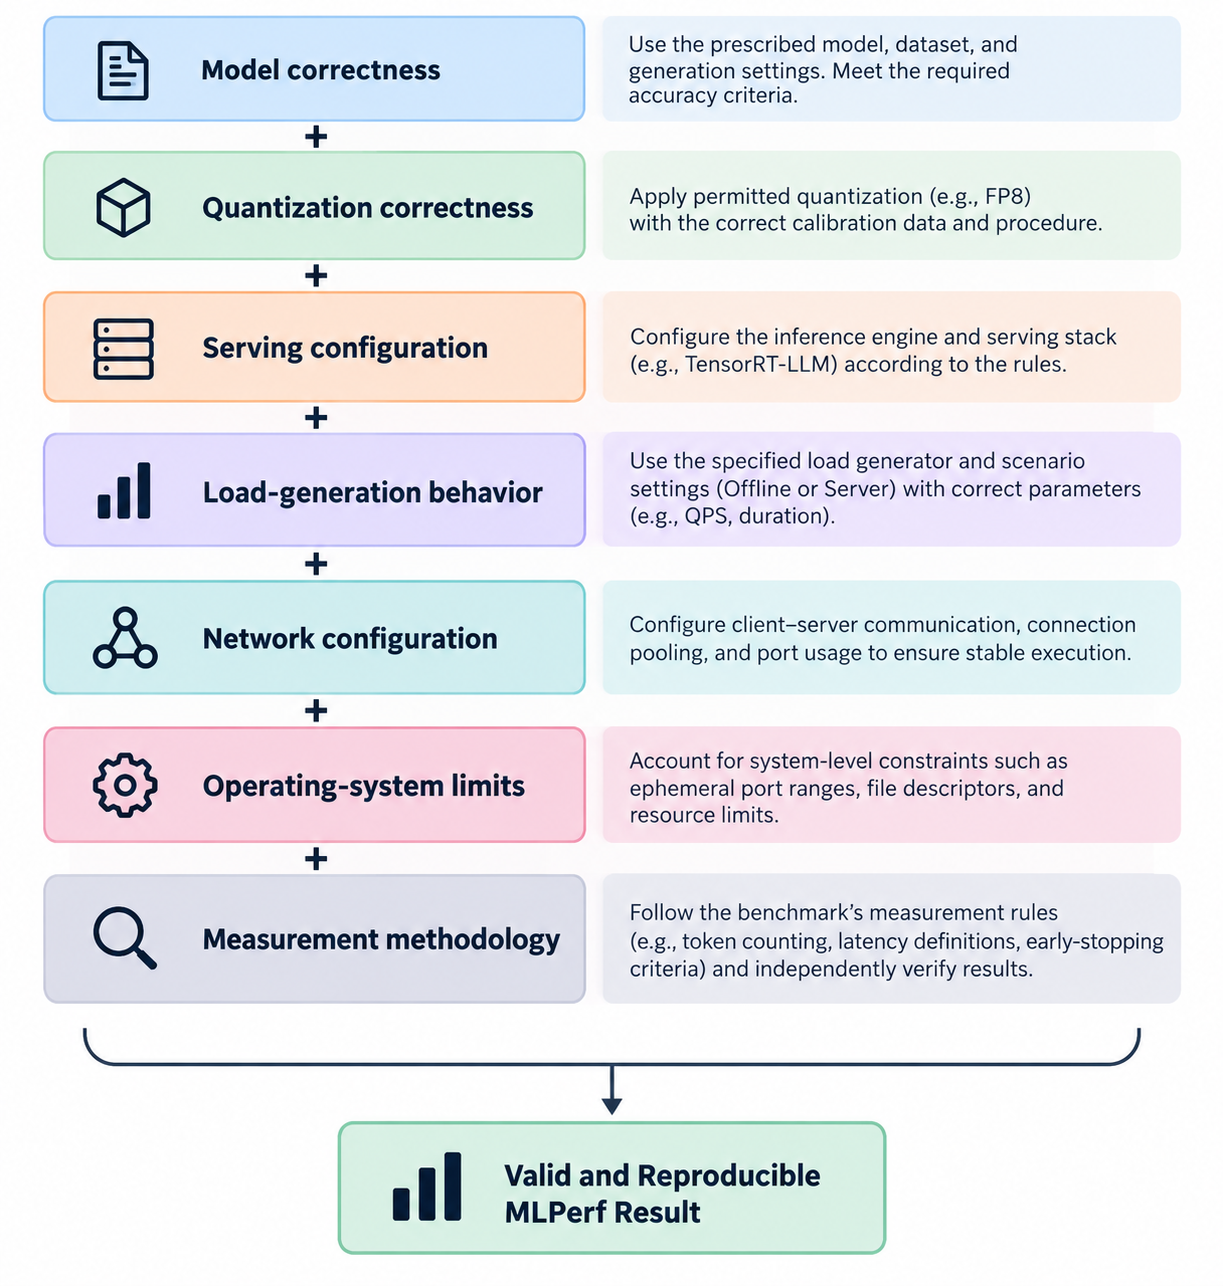
Issues such as cross-request KV reuse, ephemeral-port exhaustion, HTTP connection-pool sizing, and Server operating-point selection can materially affect a run even though they occur outside the model’s core numerical computation. For that reason, reproducibility requires more than publishing a throughput number. It requires preserving enough configuration and raw measurement data to reconstruct why the result is valid. The complete MLPerf submission contains the code, configuration files, calibration information, accuracy artifacts, and scenario-specific documentation used for these measurements.
Acknowledgement. The computations in this report were run on the Kempner AI Cluster. This work has been made possible in part by a gift from the Chan Zuckerberg Initiative Foundation to establish the Kempner Institute for the Study of Natural and Artificial Intelligence. The cluster is supported by the FAS Division of Science Research Computing Group at Harvard University.